Social Media Management
-
Tier 1: Essentials – $650/month
Perfect for brands who need consistency but want to stay minimal.
Includes:
8 posts/month (mix of static, Reels, or carousels)
Monthly content calendar
Captions + hashtag strategy
Basic engagement (comments only)
Monthly performance report
Ideal for businesses that want to stay active on social but don’t have time to post themselves.
-
Tier 2: Growth (Most Popular) – $1,050/month
For brands ready to level up their online presence and reach new audiences.
Includes:
12-16 posts per month (Reels, carousels, graphics, etc.)
Content calendar & planning
Caption writing + strategic hashtags
Engagement (comments, DMs, story replies)
Monthly analytics report
1-2 stories per week
One branded Canva template set
Monthly strategy check-in call (30 mins)
Great for small businesses or brands who want growth, not just presence.
-
Tier 3: All-In – $1,550/month
Your social media—fully done for you, content to connection.
Includes:
20+ posts per month (video-focused & visually branded)
Full content planning + weekly posting
Captions, hashtags, geotags, CTAs
Daily engagement (comments, DMs, liking/replying)
3-4 story days per week
Monthly strategy call (60 mins)
Custom branded templates
Influencer & UGC strategy support
Add-on: TikTok repurposing or IG growth strategy
Best for brands who want to grow fast and be fully hands-off with their socials.
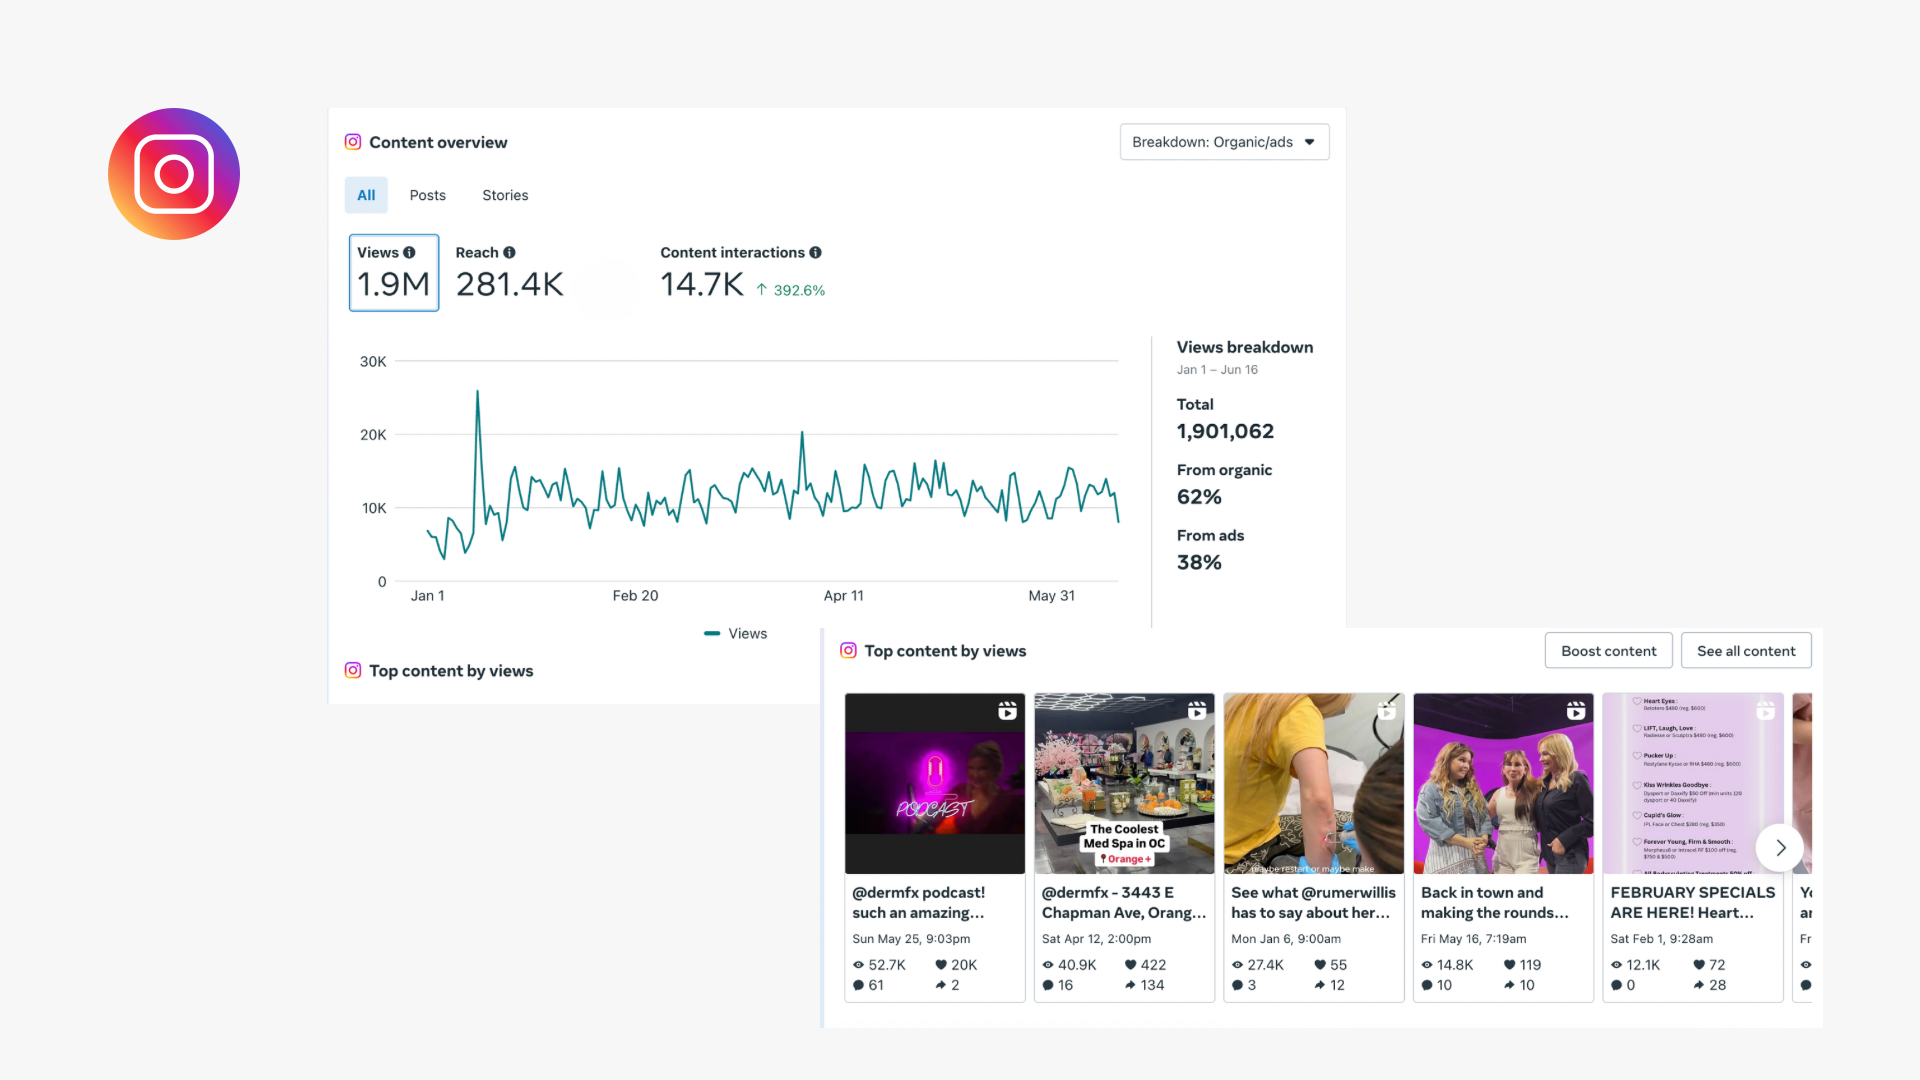
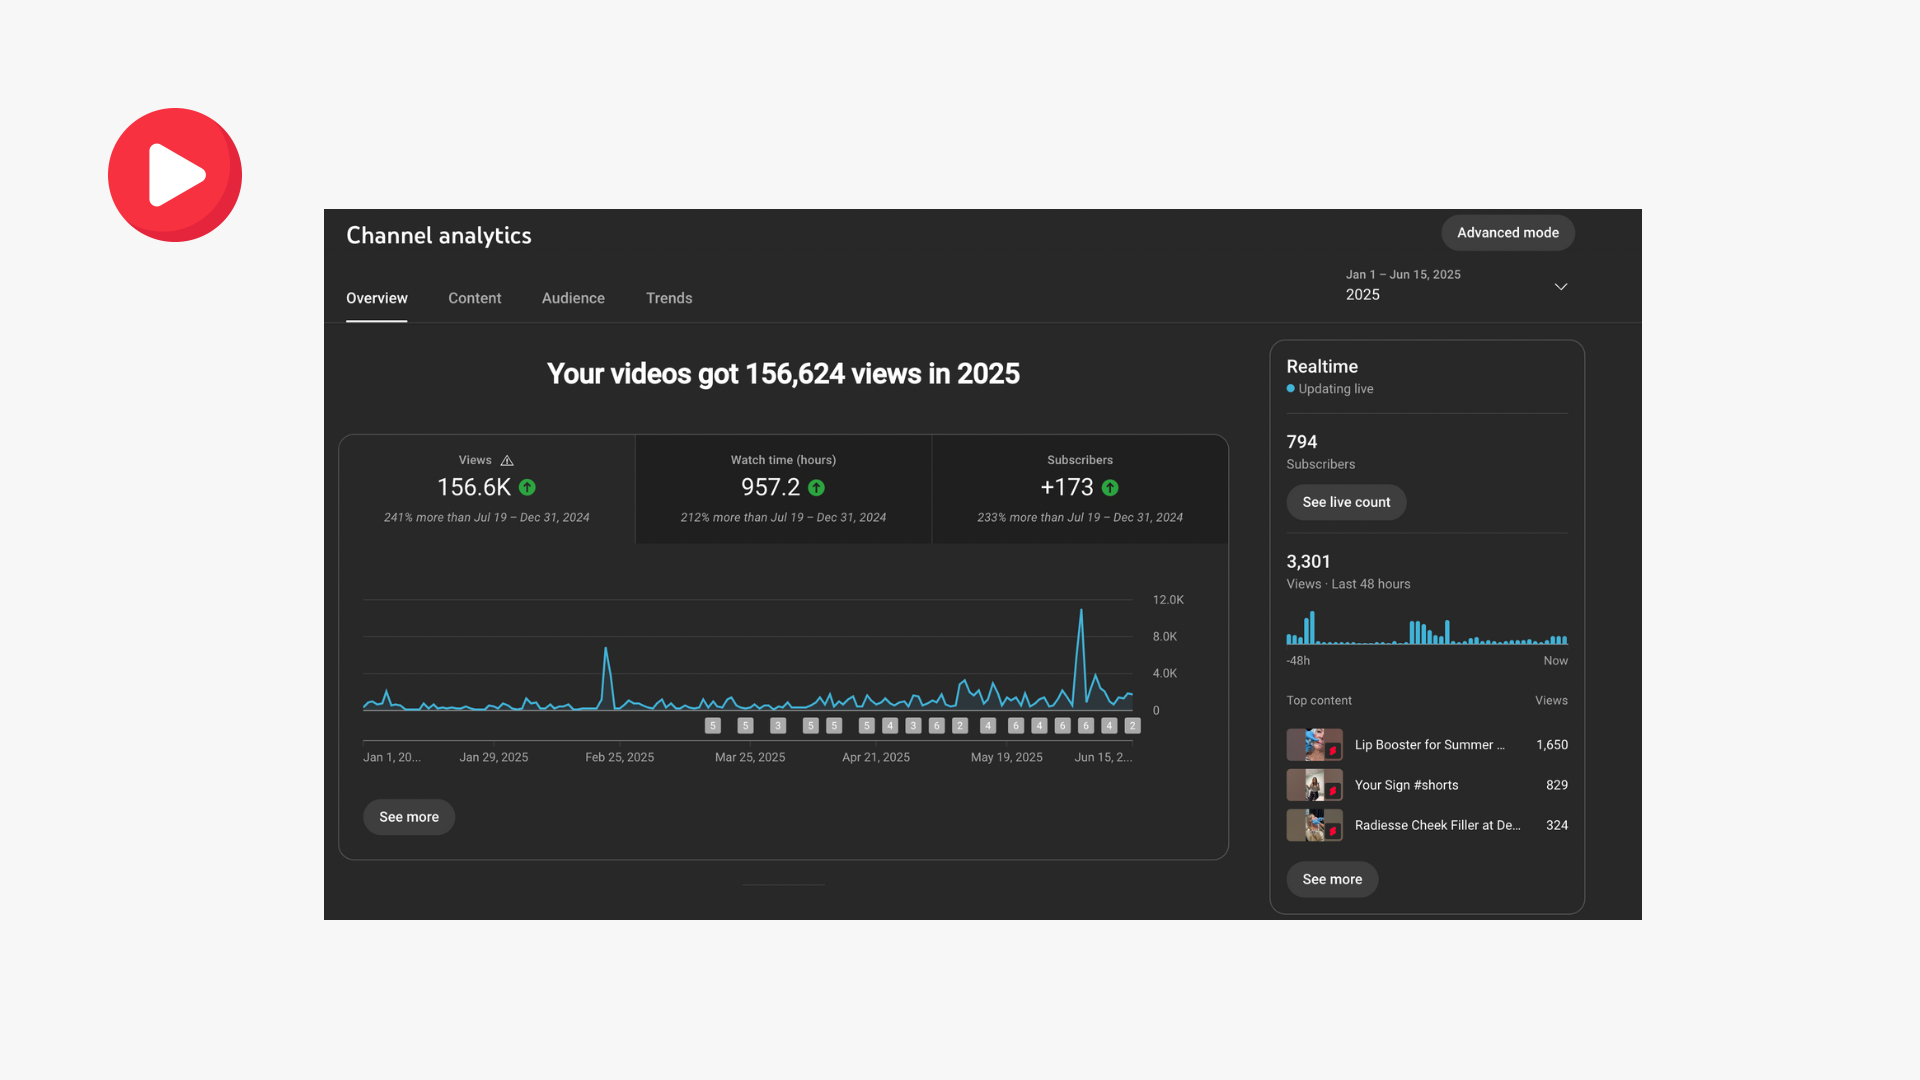
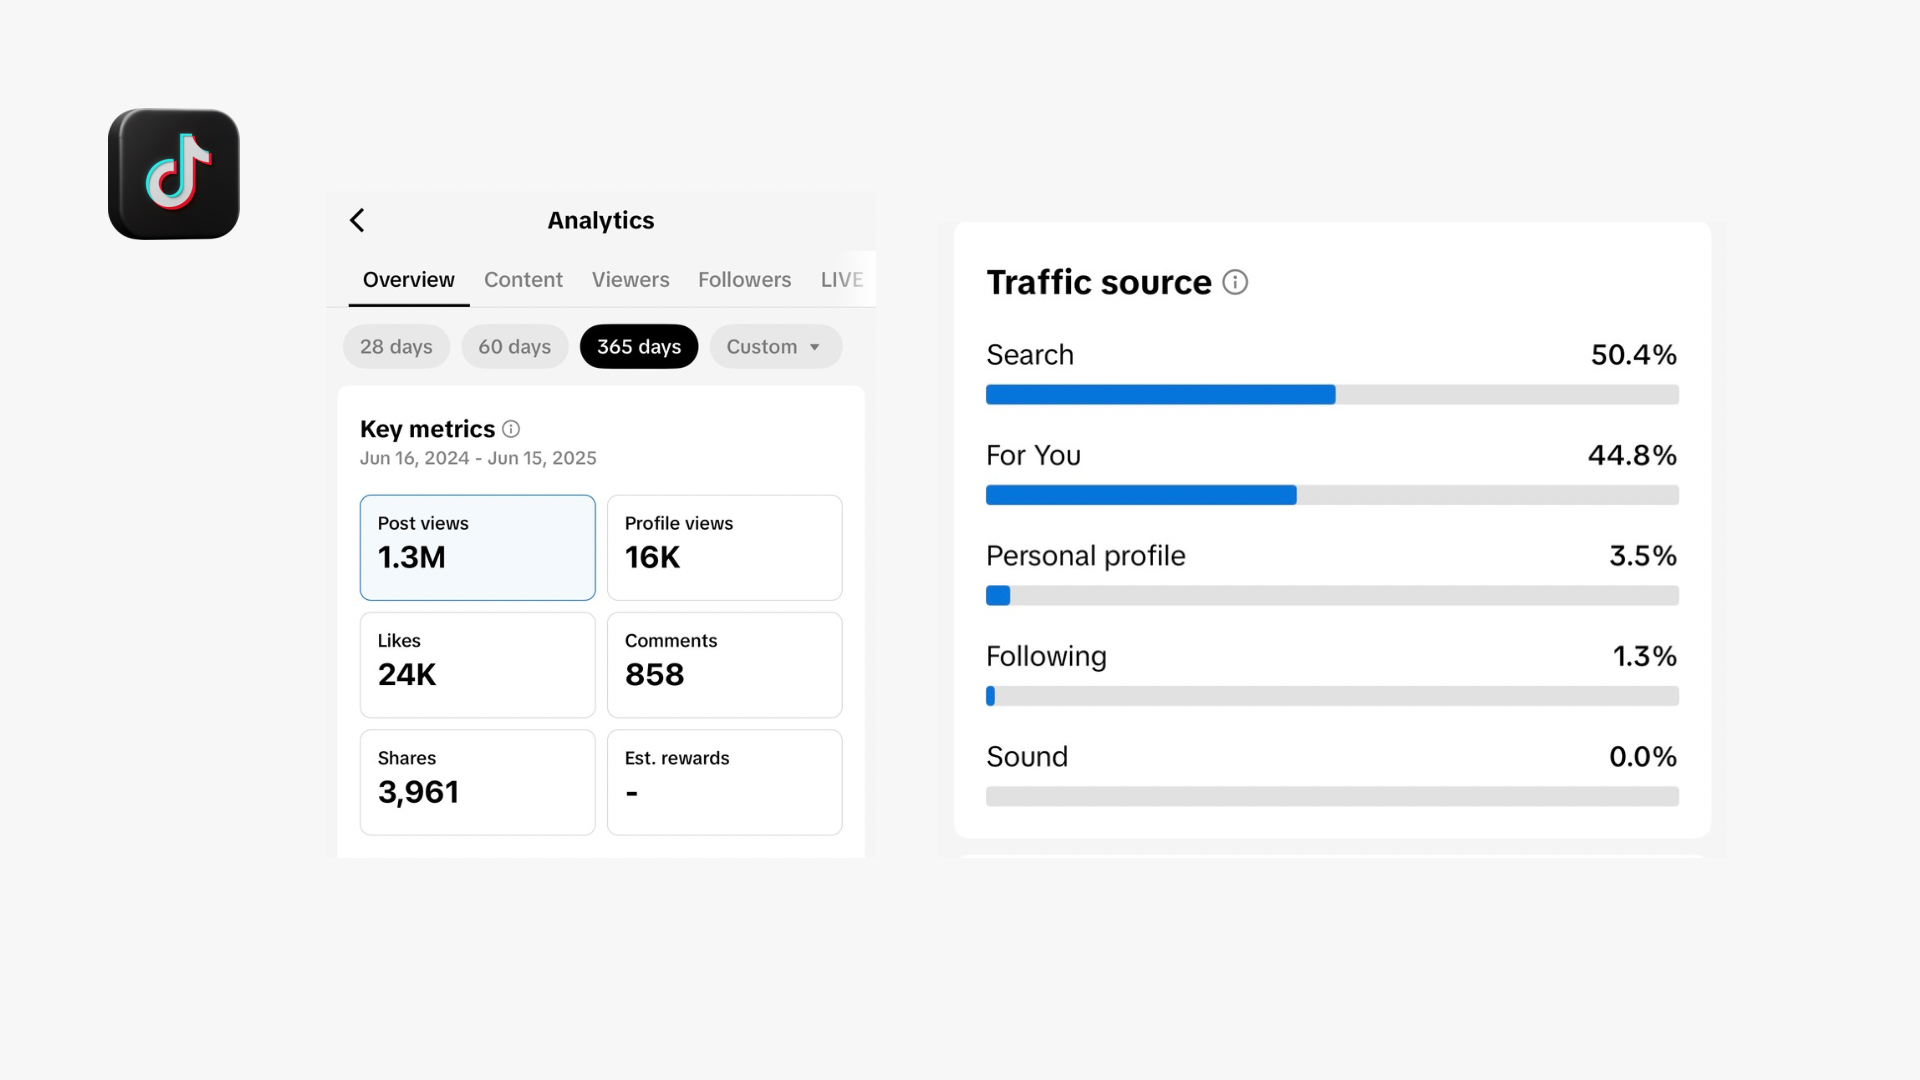
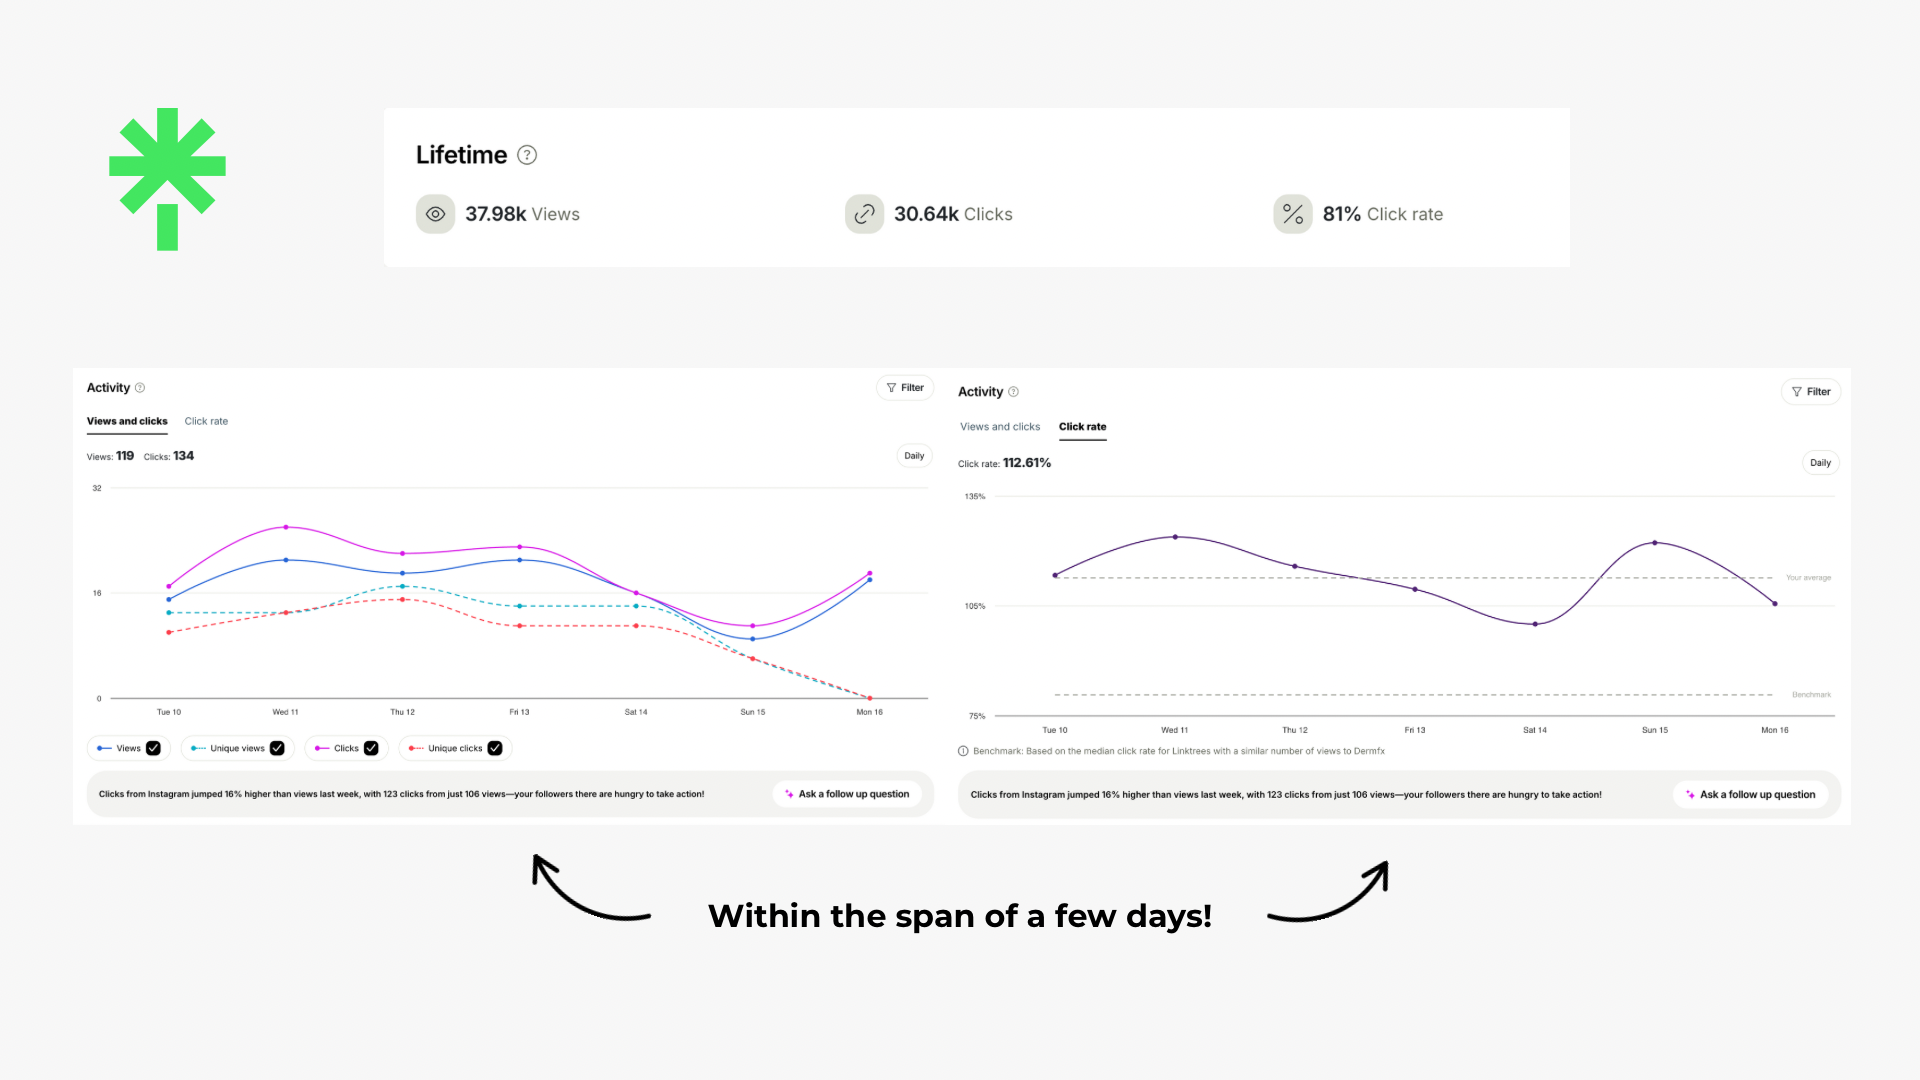
Client Results
400% growth in LESS THAN A YEAR